Yesterday I posted about the results of the Livingston Survey regarding the economic outlook for the U.S. I was surprised to find that the survey participants are also asked to forecast for the level of the S&P 500 for periods ranging up to 24 months ahead.
So, are economists any better than others at forecasting the stock market? Not really.
Due to data comparison problems, I only took a look at 6 and 12-month forecasts from 1990 onwards. The results are pretty clear, as can be seen in this graph: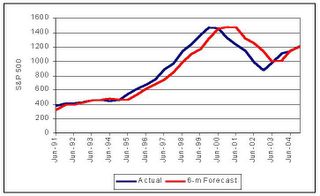
Economists commit the same sin as the average investor: their forecasts are basically just extrapolations of recent trends. And even in periods where there were clear trends, these extrapolations were wide off the mark. For example, the level of stock prices was consistently underestimated in the 1990’s (not surprising given the bubble and their knowledge of long-term trends).
On average, there was a +/- 15% error margin for 6-month forecasts, which rose to +/- 20% in the 12–month horizon.
If you had trusted them to manage your money, say by allocating between stocks and bonds, you would’ve had terrible results. That’s perhaps the reason that on Wall Street economists are mostly confined to the safety of research departments.
Thursday, June 09, 2005
Forecasting stocks
Wednesday, June 08, 2005
Want to know what economists are thinking?
Just go and check out the results of the Livingston Survey, the oldest continous survey of U.S. economic forecasts (in business since 1946). Reuters has a good summary here.
The results are very similar to the ones I described a few days ago (based on a Federal Reserve survey): growth will stay over 3% and inflation will average 2.5% over the next ten years. Thus, economists see long-term interest rates rising to 5% as early as next year.
Needless to say, the bond market begs to differ. Only time will tell who's right.
Of spreads and stocks
As if the long-term rate conundrum weren’t enough, I’m afraid we have another puzzle on our hands, this time related to the behavior of bond spreads and stock prices.
Spreads –in this case the difference between the yields of Baa-rated bonds and 10-year Treasuries--are usually high during recessions or periods of slow growth and tend to fall in more prosperous times. They aren’t correlated with the level of rates, but they do show a strong negative response to changes in rates: that is, spreads rise when rates fall and vice versa. The cause is clear: falling rates imply lower expected inflation, which in turn reflects slower growth in the economy and a lower earnings performance in firms.
The following graph shows normalized (i.e. long term average =1) 10-year yields and Baa spreads.
img src="http://photos1.blogger.com/img/31/6194/320/spreads.jpg">.
A few brief observations:
· After 2000, spreads went wild, reaching never before seen heights despite the fact that the 2001 recession was pretty mild. This probably reflects structurally higher leverage.
· Despite robust economic growth in 2004/2005, spreads are still pretty high relative to the long run average.
· As was to be expected, spreads have risen sharply in the past few weeks, in tandem with falling long-term rates.
· Spreads will only fall to long-term average levels if rates rise towards 5%.
The central message here is that the recent fall in rates is not good news, as it signals a weaker economy that will lower credit quality and raise the level of financial risk.
However, it’s worth noting that stocks in the U.S. have posted gains in the last two months, a period in which spreads rose sharply. Needless to say, this is contradictory: stocks usually move in the opposite direction of spreads.
So who’s right? I honestly wished I did. The only thing I do know is that we live in very uncertain times when traditional correlations are not working as expected. Hence, I’d have a very cautious investment policy. Cash anyone?
Tuesday, June 07, 2005
Reading the Fed's tea leaves
Like the Kremlinologists of yore, central bank watchers are always tempted to read between the lines and derive meaning from seemingly inconsequential remarks. Well, at least that's how I feel today. It seems everyone else (see here) is reading Greenspan's remarks in a different light than yours truly. I believe he might be signalling that short and long term rates were bound to rise in the none-too-distant-future, while others see these comments as a sign that rates will be low for quite some time.
We'll know more soon, as Greenspan is set to testify before Congress later this week.
Monday, June 06, 2005
Does Greenspan have a hidden agenda?
Alan Greenspan is still puzzled by the low level of long-term interest rates. In these remarks, published today, he goes over some of the hypotheses commonly mentioned: pension fund adjustments, Asian central bank purchases of U.S. bonds, expectations of an economic downturn and lower inflation expectations due to globalization. He finds them all wanting.
So, believe it or not, the world's foremost central banker doesn't know what factors are driving long-term rates lower. It seems rather absurd. He could've at least had the decency of offering his own ideas. This, in its way, is both revealing and suggestive.
My guess is that he's singalling in a very subtle way that long-term rates should be higher. I can think of two reasons (non-exclusive) for this.
First of all, given last Friday's weak employment numbers, many investors are expecting that short-term rates won't rise much more, if at all. If the Fed surprises by hiking them --or signalling to that end--more than expected, then all those people buying 10-year Treasuries at 3.9% are in for a very nasty shock, which may create instability (1994 all over again, only with a lot more leverage).
This scenario is not far-fetched. Richard Berner of Morgan Stanley argues here that the markets are underestimating the economy's strength and the that inflation will keep rising. He sees the Federal funds rate rising to 4%.
Alternatively, Greenspan may like rates to be higher to dampen some of the economy's flashpoints: the huge current account deficit, the real estate froth/bubble, some of the wilder hedge funds, etc. To a lesser or greater extent, all pose a significant risk.
If long-term rates don't rise significantly over the next few weeks, it's likely that the Maestro will be more explicit, perhaps even offering 'tentative' explanations to his 'conundrum'.
Best bet among the oil majors?
Lately, I’ve been doing a bit of researching Big Oil. At first glance, it looks like ExxonMobil –the biggest private energy firm—is doing best, by far. Over the last 12 months its stock has been the top performer in this group and it enjoys the highest valuation by any measure.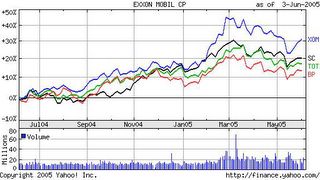 .
.
Seeing this, I was sure its operating figures must be much better than those of other (such as BP, Shell and Total). But digging deeper, this proved to be very, very false: Exxon has some of the worst figures in the industry.
For instance, take production. According to my calculations, its total oil & gas output has fallen over the last four years (by 1.5%), while BP raised it by 23% and Total by 22%. Reserves, refining and product sales point the same way.
Yes, it’s generating tons of cash for shareholders (nearly 16 billion between dividends and repurchases last year). But this also reflects the fact that it invests much less than its competitors: Exxon’s capital expenditures only took up 30% of its operating cash flow (net income + depreciation), while the other firms invest over 50%.
So, we’re talking about a firm that is basically not growing in real terms, that is probably shortchanging its future by underinvesting and whose stock is pretty expensive.
This makes me wonder whether I’m the only one missing something or most everyone else is in the dark. Well, for what its worth, I believe Total is the best choice in this group, followed by BP.
Friday, June 03, 2005
Geezers-4-Bonds?
One of the arguments to justify the current low level of long-term bond yields is demography. In the developed world, the number of over 65’s is set to rise dramatically and this group will invest their savings mainly in bonds and other fixed-income instruments.
Sounds like plain common sense. Stocks are an uncertain investment in the short and medium (less than 10 years) and people over 65 years shouldn’t be fooling around with that kind of risk.. However, people don’t always behave or invest rationally.
Take the 2001 Survey of Consumer Finances, carried out by the Federal Reserve. It shows that 21% of families whose head has over 65 years of age have direct holdings of stock, basically the same proportion as the total population. In the over 75 years group, these holdings amount to 27% of all financial assets, the highest proportion of any age group.
Taking only identifiable financial assets (meaning those that are not managed by others, such as mutual funds, retirement funds, life insurance, etc.), it turns out that directly-held stocks represent around 50% of that total in the geezers’ case, a similar proportion to other age groups.
Obviously, this data set has limitations. It’s impossible to break down managed assets by type of investment, so its possible that these holdings will be increasingly oriented to bonds. Nonetheless, the main point stands: old people are not noticeably less risk-averse in their investment choices.
It’s something I’ve seen all too often. I have relatives who still play the market well after retirement age. One was even suckered into investing in tech stocks at the height of the dot com bubble. Greed doesn’t decline with age.
Research seems to back the argument that demography plays a modest role in total and relative demand for different types of assets (see this paper). Actually, if you want to profit from the geezerification of the world, read this study (hint: the secret is in the sectors).
More on rates
People are seriously confused. While most economists still see long-term intereset rates rising towards 5%, other predict yields as low as 2.5% in the fairly near future. To get a feel for this, be sure to check out this column. As was to be expecteded, history has been dragged into the debate. Many analysts are now arguing that high rates (meaning above 10%) are an aberration, since they were very low before the inflationary 1970's. (Which does not really mean anything, since the world today bears little resemblance to times past.)
This is verily the mystery of the moment. Definitely worth looking into.
P.S. Where do you head for bond info? Look to Bondnheads, naturally.
Thursday, June 02, 2005
The real interest rate puzzle
Alan Greenspan famously puzzled over why long-term interest rates were so low when the 10-year T bond was yielding well over 4%. Today, its yield stands at 3.9%.
Lots of possible explanations have been offered (check this post). Many are based on short and medium term trends, such as yields driven down by massive foreign purchases of U.S. bonds. This basically implies that rates will rise as soon as these trends run their course, which is anybody’s guess. Another theory emphasizes that Mr. Bond Market (of James Carville fame) sees growth slowing down drastically over the next decade, which in turn will lead to persistent low inflation. That's the position held by Kash.
To clear things up a bit, it’s worth taking a look at what forecasters have to say. This Fed survey presents interesting results. The 2nd quarter forecasts see 10-year T bond rates rising to a bit over 5% in early 2006, with GDP growth slowing to 3.3% next year and inflation averaging around 2.4%.
These figures are actually very similar to the long-term forecasts (for the next ten years) made once a year, in the first quarter. Forecasters see 10-year rates averaging 5% in this period, with GDP growth at 3.3% and inflation of 2.5% over this period.
What does this mean? Once again, there are many possible interpretations. One is that short-term factors are temporarily depressing yields, which will shortly rise to 5%. The obvious problem here is, of course, that they’ve been forecasting a rise to 5% for several years and it ain’t happened.
Given that long-term inflation expectations have held very steady, it seems that the factor that has really driven long-term rates is the real rate. These forecast think it’ll average nearly 2.5% annually, but Treasury inflation-linked bonds have put it at a bit above 1.6%.
This is the real puzzle. Usually, expected long-term real rates have been a tad higher than expected real GDP growth (around 3%). That began to change in 2001, when growth forecasts exceeded expected real bond returns, a gap that has widened dramatically since last year, as it currently stands at a yawning 200 basis points.
Sounds like something has to give: either real rates will rise or long-term growth expectations have to drop.
More on this topic later, but all comments and suggestions are very welcome.
Wednesday, June 01, 2005
Original name prize
They'd have to give it to Fat Prophets, an independent equity research firm in Australia. I love it.